This article continues the definition of the tracking model based on the % Plan custom field.
Now, we will change the % Plan to a percentage format and we will also calculate a variance indicator between the % Plan and the % Complete.
The initial definition of the percent plan model is in the previous article of this blog:
Percent plan in Microsoft Project.
You may want to check out that article before read this one in order for you to have the whole picture of the model.
Let us see how to show the % Plan with a percentage format in the Project views.
To format the % Plan num field, which is a number custom field, we need to use another custom field, this one of type text that will have the same value of the % Plan num but with a percentage format. We can use the field Text1.
Fields and Formulas:
| Custom field | Name | Formula |
| Number1 | % Plan num | IIf([Baseline Start]<91313,IIf(datediff(“d”,[Status Date],[Baseline Start])<=0,IIf(datediff(“d”,[Status Date],[Baseline Finish])>0,((Projdatediff([Baseline Start],[Status Date])/([Baseline Duration]))*100),100),0),0) |
| Text1 | % Plan | Format([Number1]/100,”#0%”) |
Developing this fields over the examples we used in the previous article, we get the following columns:
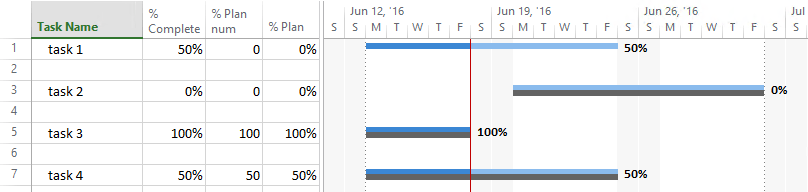
% Plan num and % Plan columns in MS Project
We can hide the % Plan num, which is redundant and get a cleaner view:
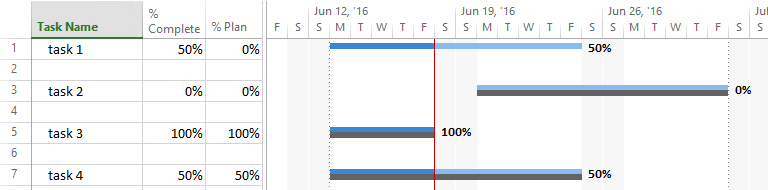
% Plan column in MS Project
In the example, the status date is Jun 17, 2016 and it is represented by the red vertical line. I have set the % Complete with the Mark on Track button for all the tasks.
Now we have the % Plan in our view, along with the % Complete.
In the next step, we will compare the % Complete (actual) versus the % Plan (forecast). To do that, we use another two custom fields:
Fields and formulas:
| Custom field | Name | Formula |
| Number2 | Progress Var num | Int([% Complete] + 0.5) –Int([Number1]+0.5) |
| Text2 | Progress Var | Format([Number2]/100,”#0%”) |
What we get now is:
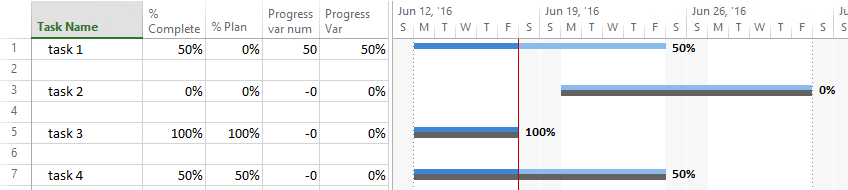
% Complete vs % Plan variation in MS Project
Once we have the variation between the actual and the planned advance, we could generate a graphical indicator to have an easy insight on task that are late, ahead or on plan. This will be described in the next article.
Until now, all the talk, the fields and formulas have been about detail tasks but surely, you are asking: what happen with the summary tasks?
In all the custom fields’ definitions, ensure that the Use formula option for the summary rows is selected, so the fields in the summary tasks are calculated using the same formula than the detail tasks.
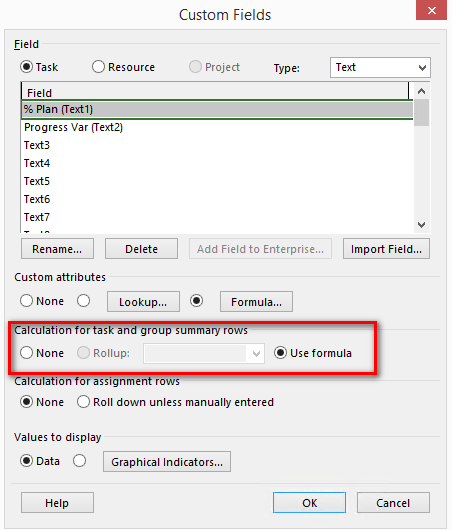
Use formula in the %Plan custom field on MS Project
Example with summary task:
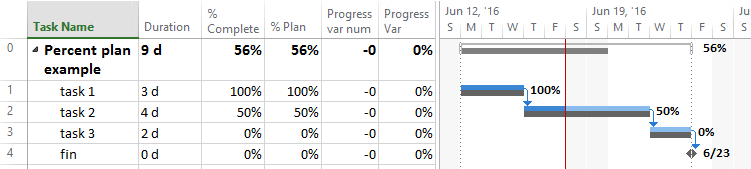
% Complete vs % Plan variance in MS Project
Please note that:
- Summary tasks must have their baseline in order to calculate the % plan.
- The value % Complete on the summary task takes into account the % Complete of the detail tasks, and weights them based on the duration of each task. In this example the % Complete for the summary task is ((100%*3) + (50%*4*10))/ 9 = 56%.
- As for the % Plan on the summary task, it is calculated using the formula we set in the number1 custom field, which is based on the status date and the baseline duration of the task.
As you can see, the model uses two different methods to calculate the % Complete (Microsoft definition) and the % Plan (our definition). The question now is ¿will this work correctly in my projects?
Well, unfortunately, most of the times the % Plan will not be consistent with the % Complete.
Both fields are consistent only when the distribution of the detail tasks is uniform in time.
The last example above shows us a set of detail tasks with uniform distribution in time and, therefore, the % Plan and the % Complete are consistent with a value of 56%.
However, if the detail tasks are not uniformly distributed, then the % Plan, is not consistent.
Example of detail tasks with non-uniform distribution in time:
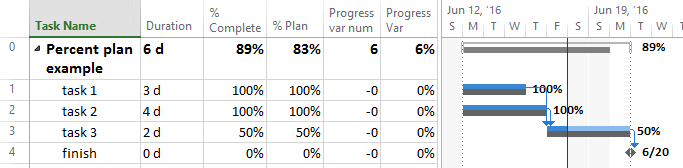
% Plan and % Complete with summary task on MS Project
In this example, we get a % Plan that is not consistent with the % Complete. You can see that because, even when the tasks has actual progress according to the plan, the project summary task has a variation of 6%.
One conclusion is that we need to define a more robust model, one that always calculate the % Plan in a consistent way with respect to the % Complete. In a future article, I will present you such a model.
I should mention here that another way to do all this is using the Earned Value Method (EVM) which is immerse in the Microsoft Project. Nevertheless, we will continue to elaborate the % Plan model as an alternative to the EVM, for those of you who are seeking for an easier tracking method than the EVM within MS Project. Besides, this trek allows us to discover how to customize the Microsoft Project to work as per our needs, which is always fun.
More articles on the subject:
Percent Plan in Microsoft Project – Part 1
Percent Plan in Microsoft Project – Part 3
On the following page you can find information of a more robust and complete version of this model:
Percent Plan Model for Microsoft Project
This is all for now, thank you for read and have a good day!
