This post continues the definition of the tracking model based on the % Plan custom field.
We will use custom fields to create a performance index that compares the % Complete with the % Plan values.
You may want to check out the previous articles before this one in order for you to have the whole picture:
Percent plan in Microsoft Project – Part 1
Percent plan in Microsoft Project – Part 2
Let us start knowing the project we will use in this post:
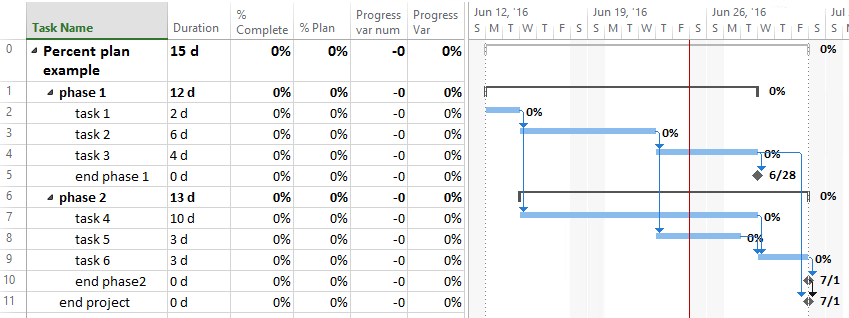
Project example for Percent plan model
In this example:
The project start date is Jun 13, 2016.
The status date, represented by the red line, is Jun 24, 2016
The fields in the view are the ones we have defined in the previous articles in the blog.
As shown in the image, the project has not baseline neither actual progress yet, that is why all the indicators are on zeros.
Next, we will define a performance index for each task on our project.
We will use the Number3 custom field for the numeric value, and the Number4 for the graphical representation. The definitions for these fields are:
Fields and Formulas:
| Custom field | Name | Formula |
| Number3 | PI num | IIf([Number1]=0,-1000,[% Complete]/[Number1]) |
| Number4 | PI g | [Number3] |
The -1000 value is used in the formula to identify the tasks with % Plan num (Number1) field equals 0. If we don’t use this trick on the formula then we would get an error when a division by 0 occurs.
Now, we define the graphical indicators with the following ranges:
| Range | Graphical indicator | Signification |
| Equals -1000 | White | There is no indicator, the % plan is 0, usually this happens because the task baseline is in the future (after the status date). |
| Above 1.2 | Dark blue | The task progress is too good |
| Between 1.1 and 1.2 | Blue | The task progress is better than planned |
| Between 0.9 and 1.1 | Green | The task is going on as planned (or close) |
| Between 0.8 and 0.9 | Yellow | The task is behind the plan |
| Less than 0.8 | Red | The task is highly behind the plan |
In the Number4 field configuration, the values for the graphical indicators are:
| Test | Value(s) | Image |
| Equals | -1000 | White |
| Is greater than or equal to | 1.2 | Dark blue |
| Is less than or equal to | 0.8 | Red |
| Is greater than or equal to | 1.1 | Blue |
| Is less than or equal to | 0.9 | Yellow |
| Is any value | <All> | Green |
When configuring the graphical indicators for Number4 field, ensure that the summary rows and project summary task inherit the criteria from non-summary rows.
The project view with the two new fields:
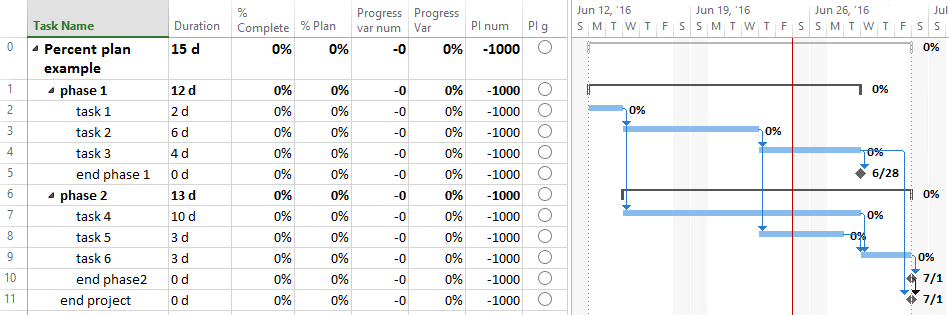
Project example with performance index fields
Now, we generate the baseline and register actuals and forecasts for the detail tasks as for the status date. The result is:
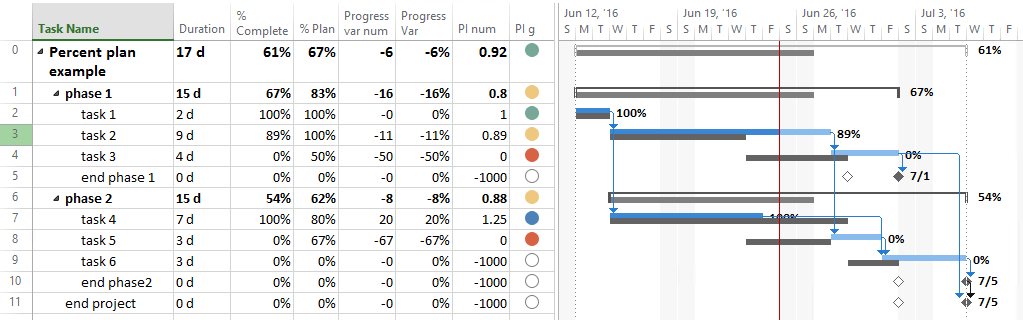
Project example with performance index (numeric and graphical)
You can see now the indicators, not only for the detail tasks but also for the summary tasks and for the project summary task (task 0).
Even more, we can create a new view to show only the most relevant fields. This view can be the base for our project performance report:

Project view with the performance indicators for the % Plan model
You think this can be useful?
Well, I think it is. This model is a simple way to have a % Plan along the % Complete and the performance indicators that we can use to track our project. I like it.
On the following page you can find information of a more robust and complete version of this model:
Percent Plan Model for Microsoft Project
This is all for now, thank you for read and have a fun day!
